Quickstart
This is a very simple example using the inbuilt Battery Monitor example. The javascript library used for Web Bluetooth is p5.ble.js.
Steps to Run
- Load the
BatteryMonitorexample from ArduinoBLE Library - Open the Serial Monitor (it’s important, otherwise the sketch won’t progress forward to transfer data)
- Goto the
bluetooth/web_bluetoothfolder in master and open the html file in Chrome. - Connect and watch the value change in the box
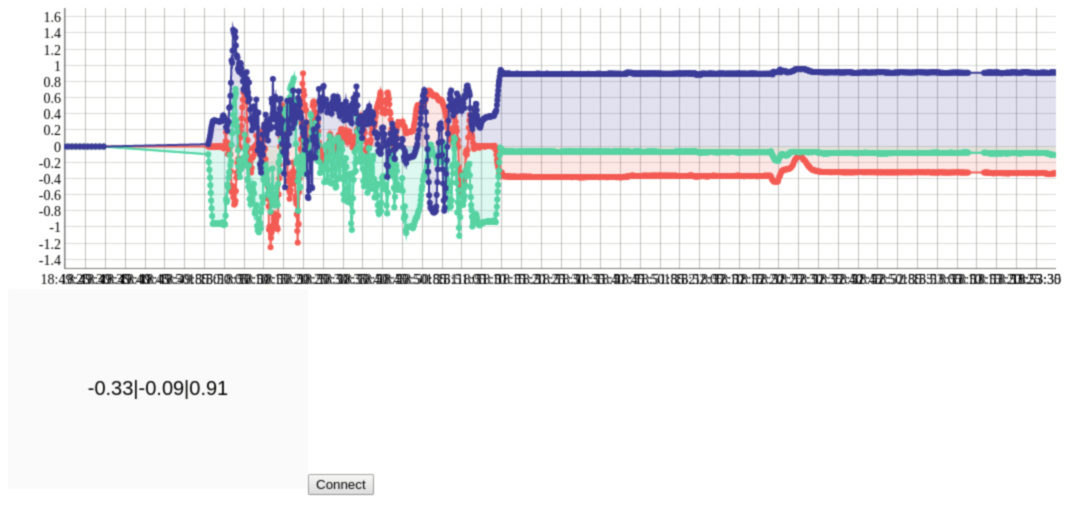
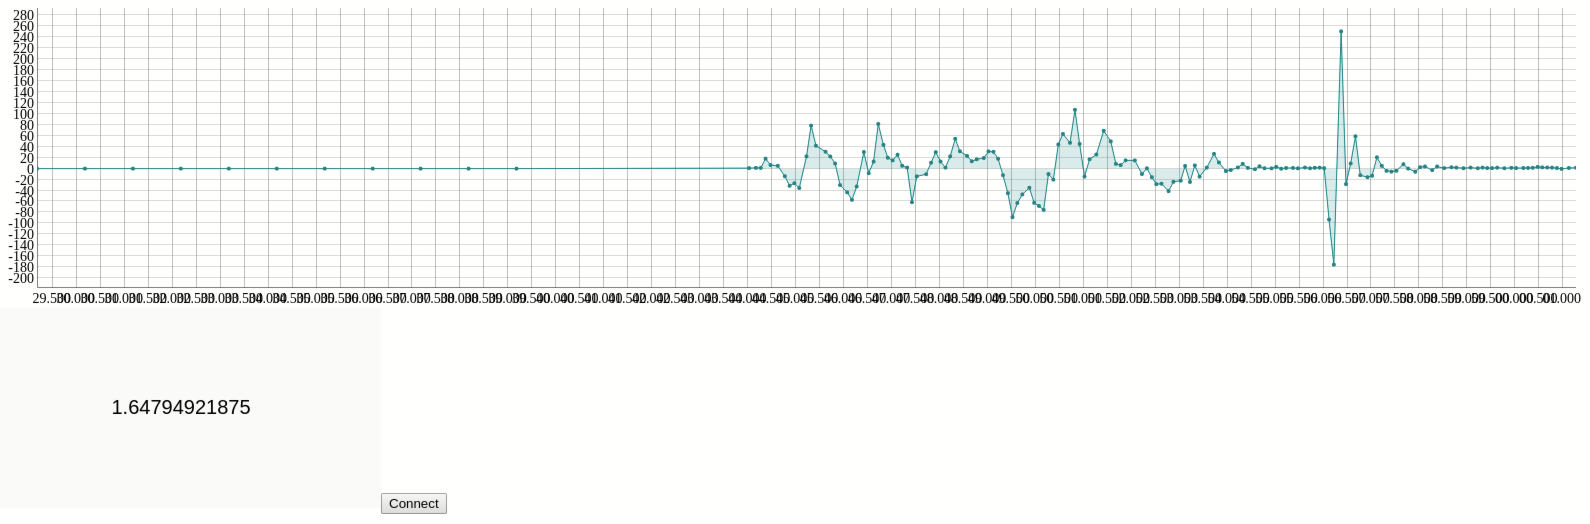
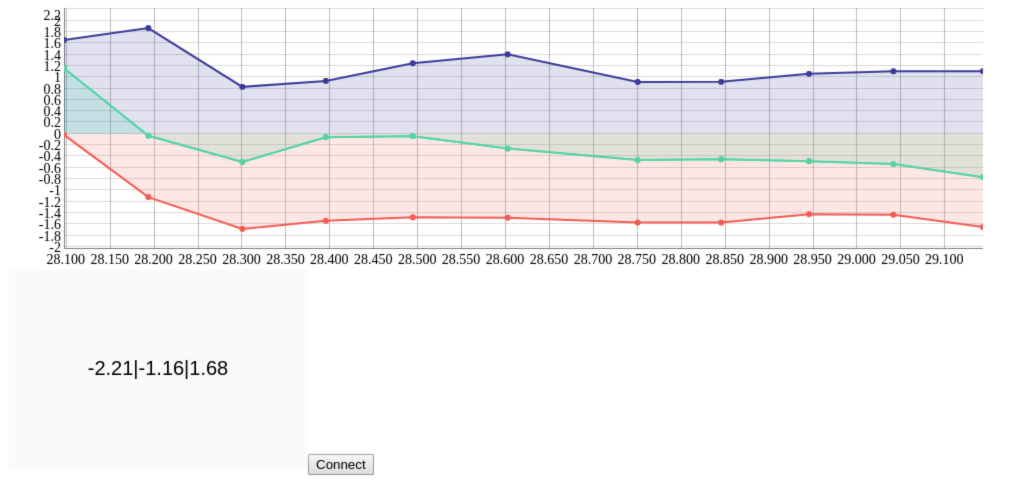
Web Bluetooth Real Time Accelerometer Data Plotting
For real time plotting I am using the dygraph.js library.
Demo
- Load the accelerometer_xyz_plotting sketch on your Nano 33 BLE
- Open the Serial Monitor (it’s important, otherwise the sketch won’t progress forward to transfer data)
- Open the index.html page in Chrome (other browsers are not supported) and connect to your Arduino Nano 33 BLE and watch the graph update.
OR
Visit this Web Bluetooth based Real Time Plotting (after uploading the sketch and opening Serial Monitor) and follow the prompts.
-
Random Plot
-
Data Points shift left
-
All data points stay