Geospatial plot of cases in US
Interactve Geospatial plot of cases using a point chart for showing case numbers, geoshape plot for state boundaries and text plot for state names

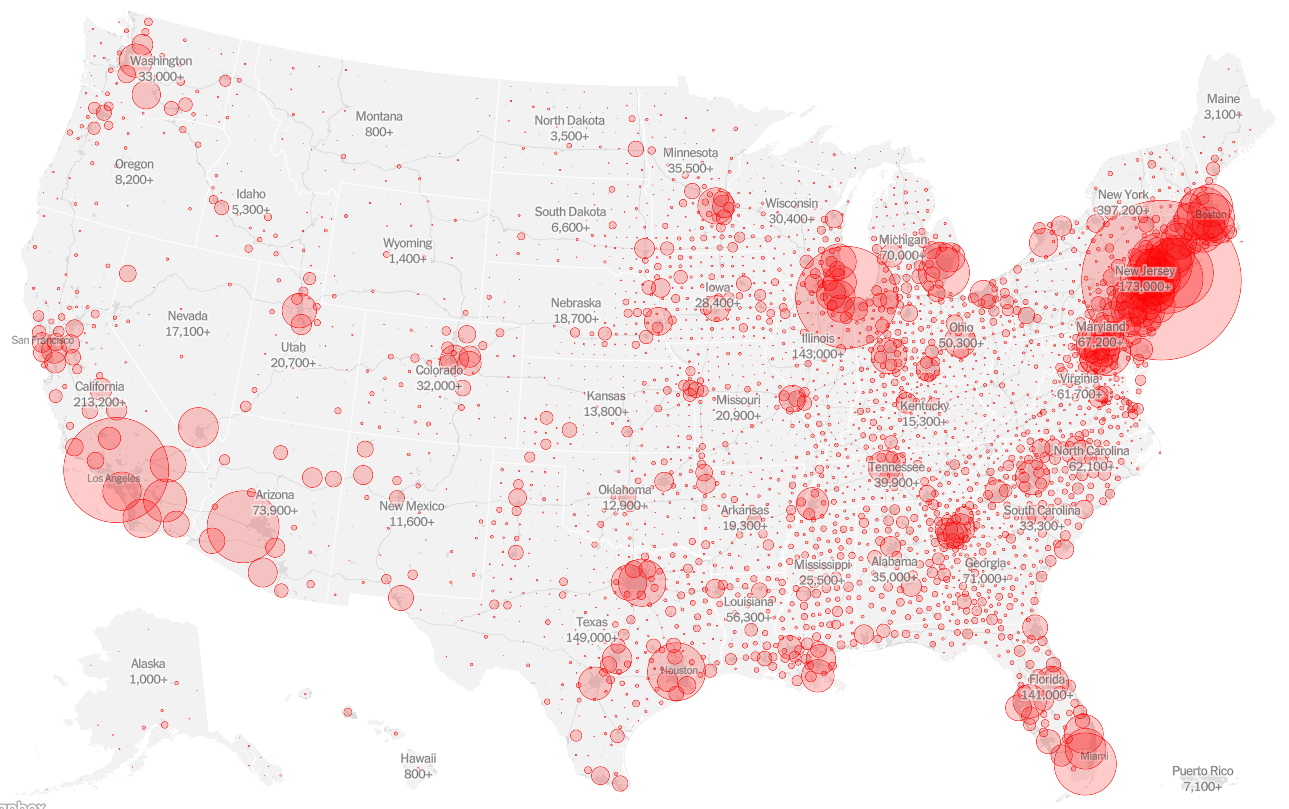
Today we will make our first geospatial map from the article Coronavirus in the U.S.: Latest Map and Case Count which looks like the folowing -
import geopandas as gpd
import altair as alt
import pandas as pd
alt.renderers.set_embed_options(actions=False)

# Shapefiles from us census
state_shpfile = './shapes/cb_2019_us_state_20m'
county_shpfile = './shapes/cb_2019_us_county_20m'
states = gpd.read_file(state_shpfile)
county = gpd.read_file(county_shpfile)

# Adding longitude and latitude in state data
states['lon'] = states['geometry'].centroid.x
states['lat'] = states['geometry'].centroid.y

# Adding longitude and latitude in county data
county['lon'] = county['geometry'].centroid.x
county['lat'] = county['geometry'].centroid.y
# NYT dataset
county_url = 'https://raw.githubusercontent.com/nytimes/covid-19-data/master/us-counties.csv'
cdf = pd.read_csv(county_url)
cdf[cdf['fips'].isnull() == True].groupby(['county']).sum()
#hide_output
cdf[cdf['fips'].isnull() == True].groupby(['county', 'state']).sum()
NYT publishes the data for New York City in a different way by combining the results of the 5 boroughs that comprise it. So we will combine them too and add a new row in the dataset with a custom fips of 1. Let's start by making this change in the raw NYT dataset itself.
cdf.loc[cdf['county'] == 'New York City','fips'] = 1
cdf[cdf['county'] == 'New York City']
# collapse
latest_cases = cdf.groupby('fips', as_index=False).agg({'county': 'last', 'date': 'last', 'state': 'last', 'cases': 'last', 'deaths': 'last'})
latest_cases
Now we have to make the changes in our shapefile too. For that we need to **dissolve** the 5 buroughs into one single geospatial entity.
#New York City fips = 36005', '36047', '36061', '36081', '36085 which corresponds to New York, Kings, Queens, Bronx and Richmond
spatial_nyc = county[county['GEOID'].isin(['36005', '36047', '36061', '36081', '36085'])]
combined_nyc = spatial_nyc.dissolve(by='STATEFP')
alt.Chart(spatial_nyc).mark_geoshape(stroke='white', strokeWidth=3).encode() | alt.Chart(combined_nyc).mark_geoshape(stroke='white', strokeWidth=3).encode()
agg_nyc_data = spatial_nyc.dissolve(by='STATEFP').reset_index()
agg_nyc_data['GEOID'] = '1'
agg_nyc_data['fips'] = 1
agg_nyc_data['lon'] = agg_nyc_data['geometry'].centroid.x
agg_nyc_data['lat'] = agg_nyc_data['geometry'].centroid.y
agg_nyc_data
# hide_output
county_nyc = gpd.GeoDataFrame(pd.concat([county, agg_nyc_data], ignore_index=True))
county_nyc['fips'] = county_nyc['GEOID']
county_nyc['fips'] = county_nyc['fips'].astype('int')
county_nyc
# generate FIPS in the shapefile itself by combining STATEFP and COUNTYFP
#county2['STATEFP'] + county2['COUNTYFP']
#latest_cases['fips'] = latest_cases['fips'].astype('int')
latest_cases['fips'].isin(county_nyc['fips']).value_counts()
latest_cases[latest_cases['county'] == 'New York City']
county_nyc[county_nyc['fips'] == 1]
# collapse
latest_cases_w_fips = county_nyc.merge(latest_cases, how='left', on='fips')

circle_selection = alt.selection_single(on='mouseover', empty='none')

circles = alt.Chart(latest_cases_w_fips).mark_point(fillOpacity=0.2, fill='red', strokeOpacity=1, color='red', strokeWidth=1).encode(
    latitude="lat:Q",
    longitude="lon:Q",
    size=alt.Size('cases:Q', scale=alt.Scale(domain=[0, 7000],),legend=alt.Legend(title="Cases")),
    tooltip=['county:N', 'cases:Q', 'deaths:Q'],
    color = alt.condition(circle_selection, alt.value('black'), alt.value('red'))
).project(
    type='albersUsa'
).properties(
    width=1000,
    height=700
).add_selection(
    circle_selection
)

state = alt.Chart(states).mark_geoshape(fill='#ededed', stroke='white').encode(
).project(
    type='albersUsa'
)

state_text = state.mark_text().transform_filter(alt.datum.NAME != 'Puerto Rico').encode(
    longitude='lon:Q',
    latitude='lat:Q',
    text='NAME',
).project(
    type='albersUsa'
)
(state+circles+state_text).configure_view(strokeWidth=0)