Covid Cases Graph
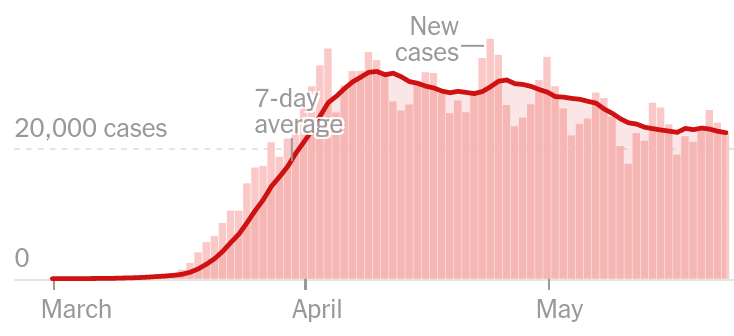
Making a layered chart comprising a bar chart of new cases, a line and area chart of a week's average of COVID-19 cases in the U.S

The graph that we will learn to make today is from the NYT article on Coronavirus Tracking in US which looks as follows -
We will take the data from NYT's GitHub repo itself. Lets jump straight into the code -
import altair as alt
import pandas as pd
alt.renderers.set_embed_options(actions=False)
url = "https://raw.githubusercontent.com/nytimes/covid-19-data/master/us.csv"
usdf = pd.read_csv(url)

usdf['new_cases'] = usdf['cases'].diff()

# Bar Chart
bar = alt.Chart(usdf).mark_bar(size=7,opacity=0.2,color='red').encode(
    x=alt.X('date:T'),
    y=alt.Y('new_cases:Q')
)

# Area Chart
area = alt.Chart(usdf).mark_area(fill='red', fillOpacity=0.15).transform_window(
    rolling_average='mean(new_cases)',
    frame=[-6,0] # NYT uses [-6,0] for their average NOT [-7,0]
    ).encode(
    x='date:T',
    y='rolling_average:Q'
)

# Line Chart
line = area.mark_line(**{"color": '#c11111', "opacity": 0.9, "strokeWidth": 5})

chart = (bar+area+line).configure_axis(
    grid=False,
    title=None
).configure_view(
    strokeWidth=0
).properties(width=1000)

chart
Now that we have replicated the chart effectively, lets filter the data so that we drop all the data before March as the chart from NYT shows -
That can be done in 2 ways :
- using Pandas
- using
transform_filterondate
You guessed it, we will use the latter. The code relevant to this would then be -
transform_filter(alt.datum.date > alt.expr.toDate('2020-03-01'))
#collapse
import altair as alt
import pandas as pd
url = "https://raw.githubusercontent.com/nytimes/covid-19-data/master/us.csv"
usdf = pd.read_csv(url)
#print(udf.columns)
usdf['new_cases'] = usdf['cases'].diff()

# Bar Chart
bar = alt.Chart(usdf).mark_bar(size=7,opacity=0.15,color='red').encode(
    x=alt.X('date:T'),
    y=alt.Y('new_cases:Q')
).transform_filter(alt.datum.date > alt.expr.toDate('2020-03-01'))

# Area Chart
area = alt.Chart(usdf).mark_area(fill='red', fillOpacity=0.1).transform_window( #stroke='red',  strokeWidth=2
    rolling_average='mean(new_cases)',
    frame=[-6,0] # NYT uses [-6,0] for their average NOT [-7,0]
    ).encode(
    x='date:T',
    y='rolling_average:Q'
).transform_filter(alt.datum.date > alt.expr.toDate('2020-03-01'))

# Line Chart
line = area.mark_line(**{"color": "#c11111", "opacity": 0.7, "strokeWidth": 5})

k = (bar+area+line).configure_axis(
    grid=False,
    title=None
).configure_view(
    strokeWidth=0
).properties(width=700)#width=alt.Step(500)
k
Now today or maybe a couple of days ago, NYT added interactivity to their charts. Lets do that too.
The main concept here is using Altair Selections.
For that we will use selection_single() on date field and change the opacity of the bars.
So the important code pieces are -
single_bar = alt.selection_single(fields=['date'], on='mouseover', empty='none')
opacity = alt.condition(single_bar, alt.value(0.5), alt.value(0.15))
#collapse
import altair as alt
import pandas as pd
url = "https://raw.githubusercontent.com/nytimes/covid-19-data/master/us.csv"
usdf = pd.read_csv(url)
#print(udf.columns)
usdf['new_cases'] = usdf['cases'].diff()

single_bar = alt.selection_single(fields=['date'], on='mouseover', empty='none')

# Bar Chart
bar = alt.Chart(usdf).mark_bar(size=7,opacity=0.15,color='red').encode(
    x=alt.X('date:T'),
    y=alt.Y('new_cases:Q'),
    opacity= alt.condition(single_bar, alt.value(0.5), alt.value(0.15))
).add_selection(single_bar).transform_filter(alt.datum.date > alt.expr.toDate('2020-03-01'))

# Area Chart
area = alt.Chart(usdf).mark_area(fill='red', fillOpacity=0.1).transform_window(
    rolling_average='mean(new_cases)',
    frame=[-6,0] # NYT uses [-6,0] for their average NOT [-7,0]
    ).encode(
    x='date:T',
    y='rolling_average:Q'
).transform_filter(alt.datum.date > alt.expr.toDate('2020-03-01'))

# Line Chart
line = area.mark_line(**{"color": "#c11111", "opacity": 0.7, "strokeWidth": 5})

chart = (bar+area+line).configure_axis(
    grid=False,
    title=None
).configure_view(
    strokeWidth=0
).properties(width=700)

chart
Isn't that amazing