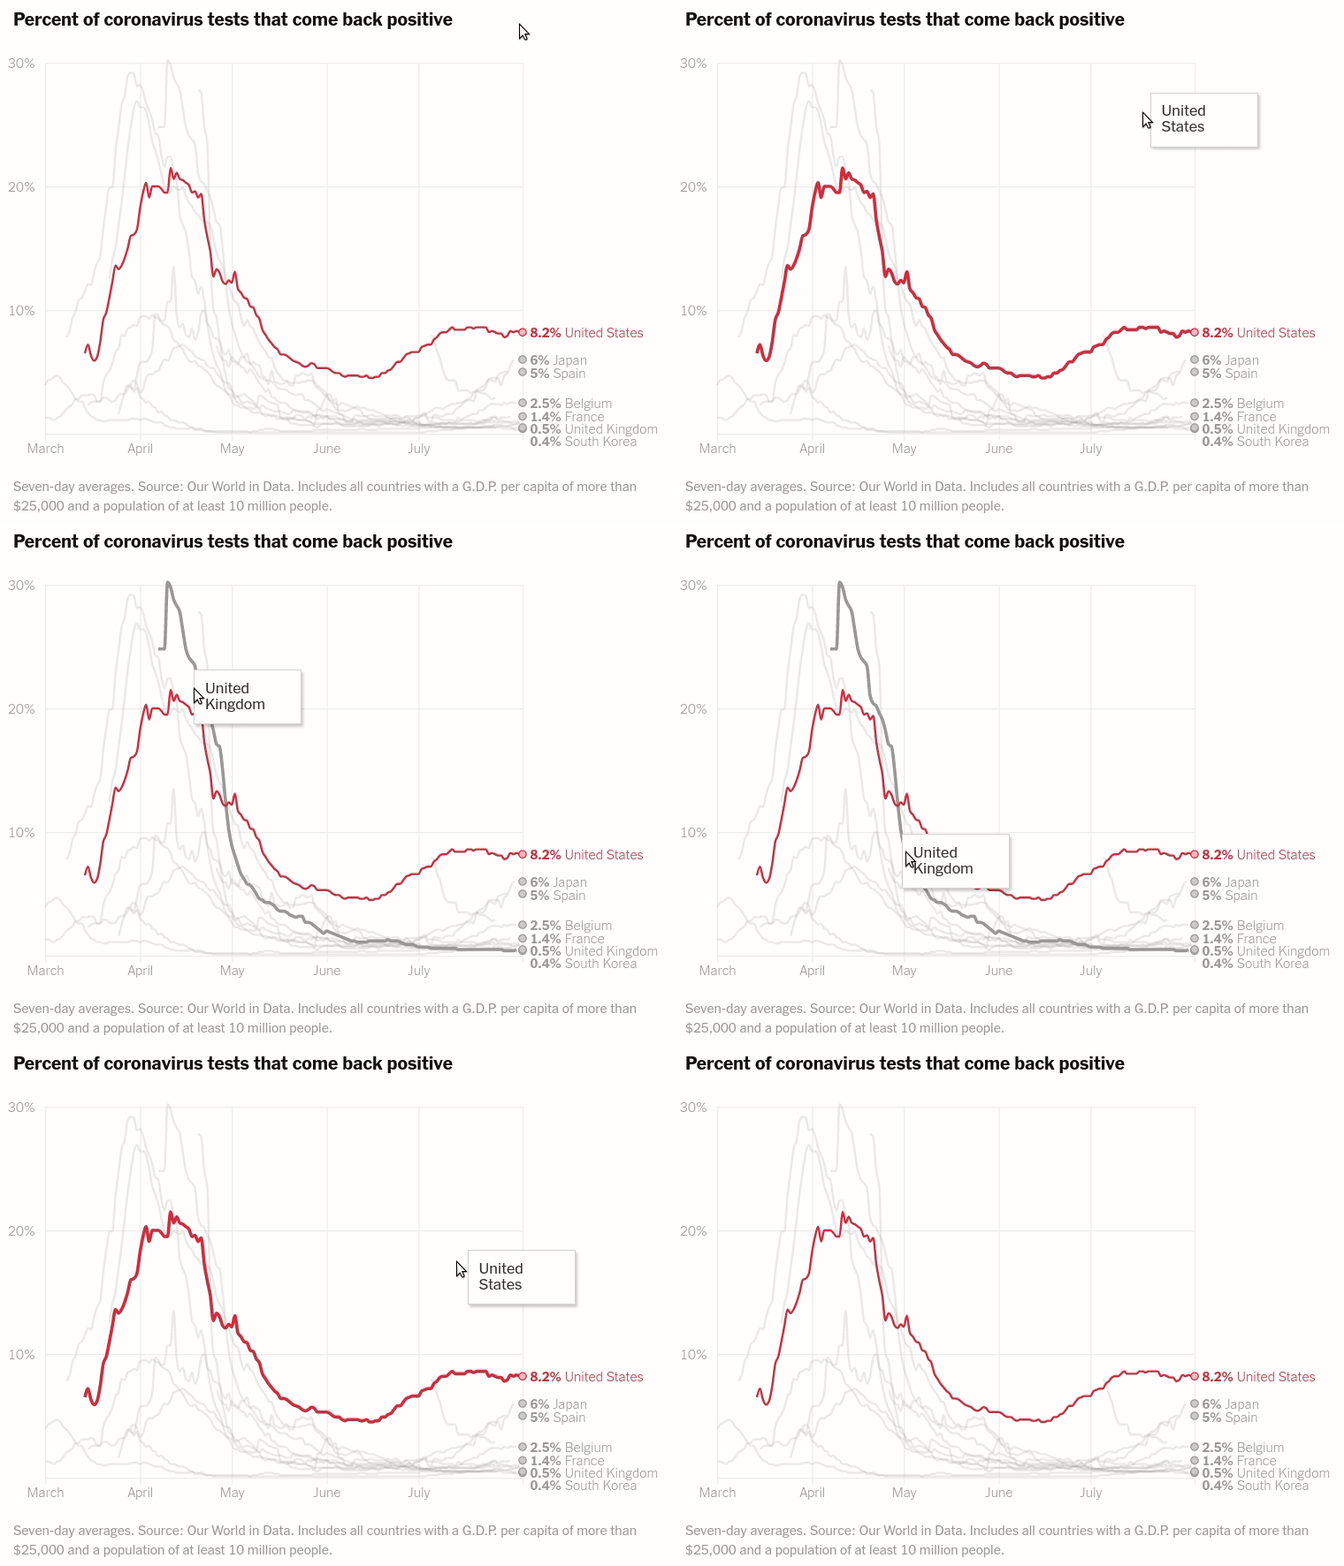
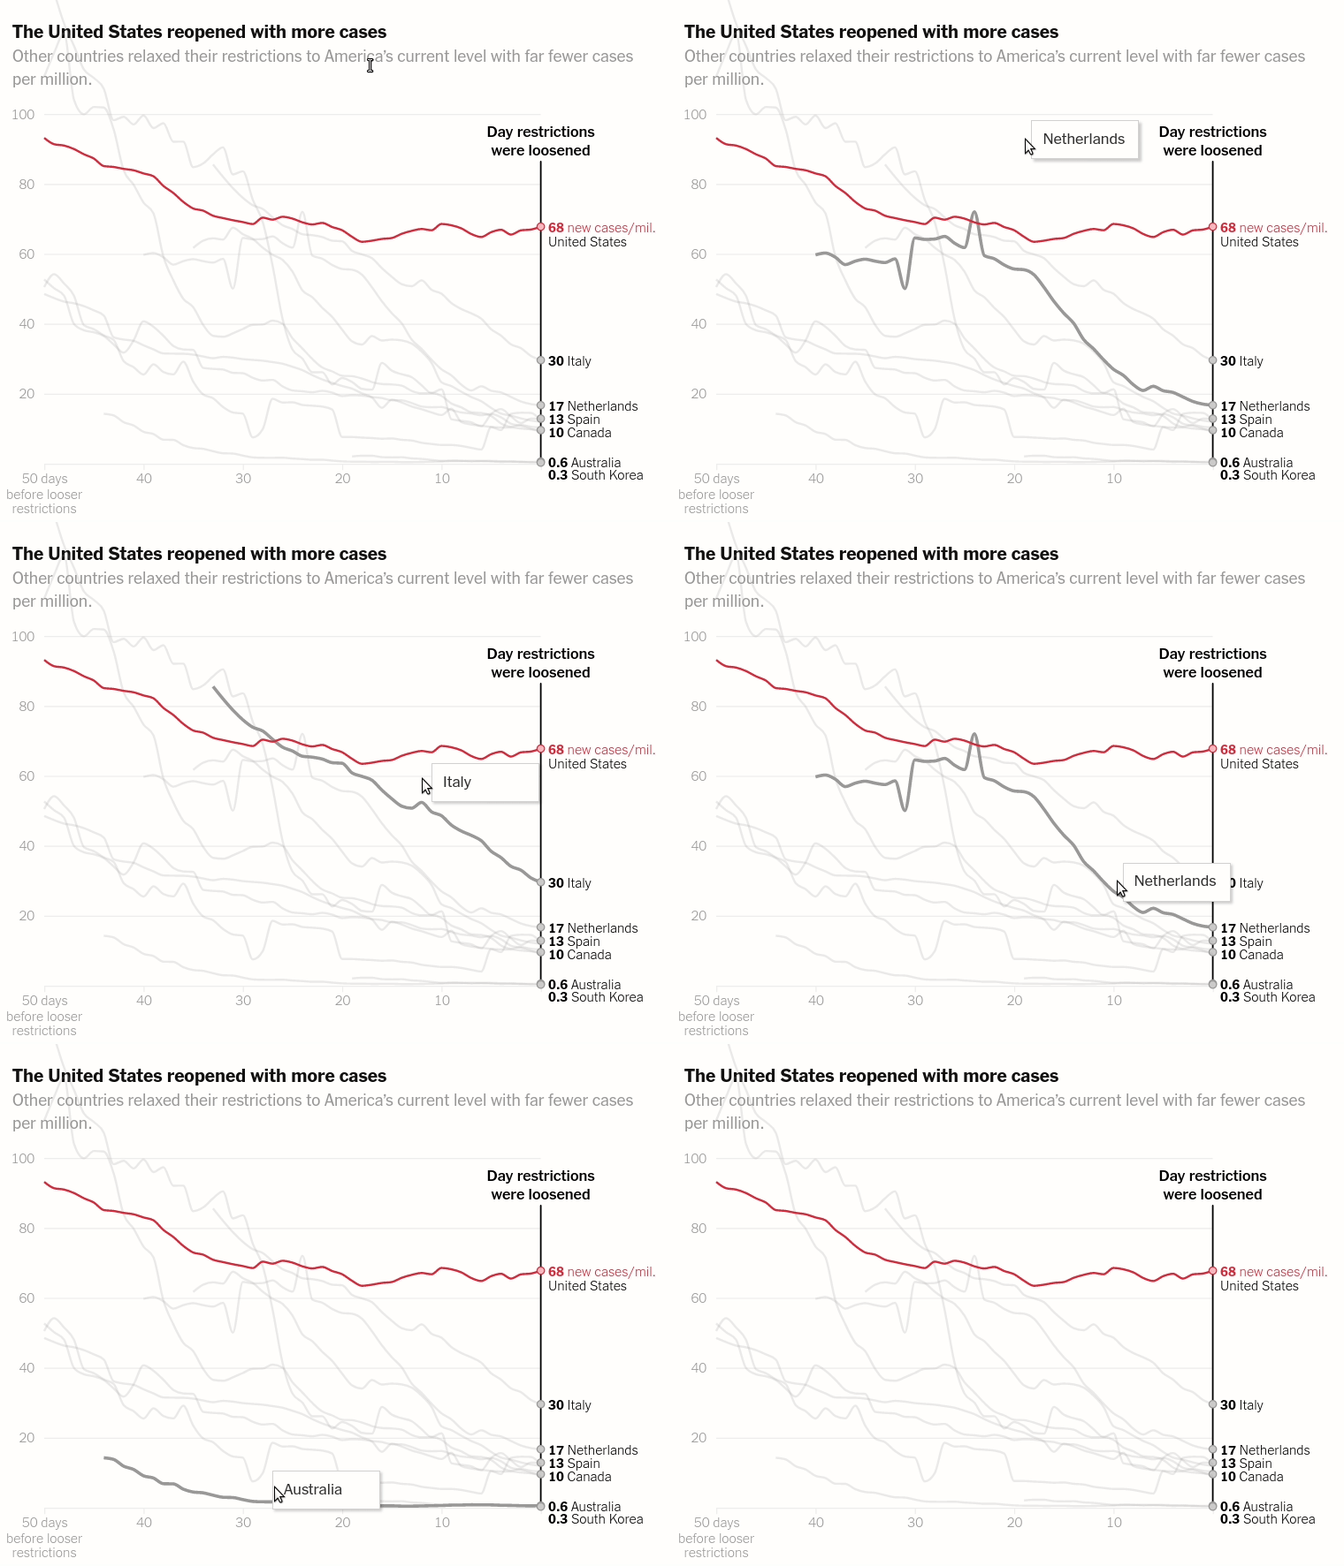
US's failure to control the virus
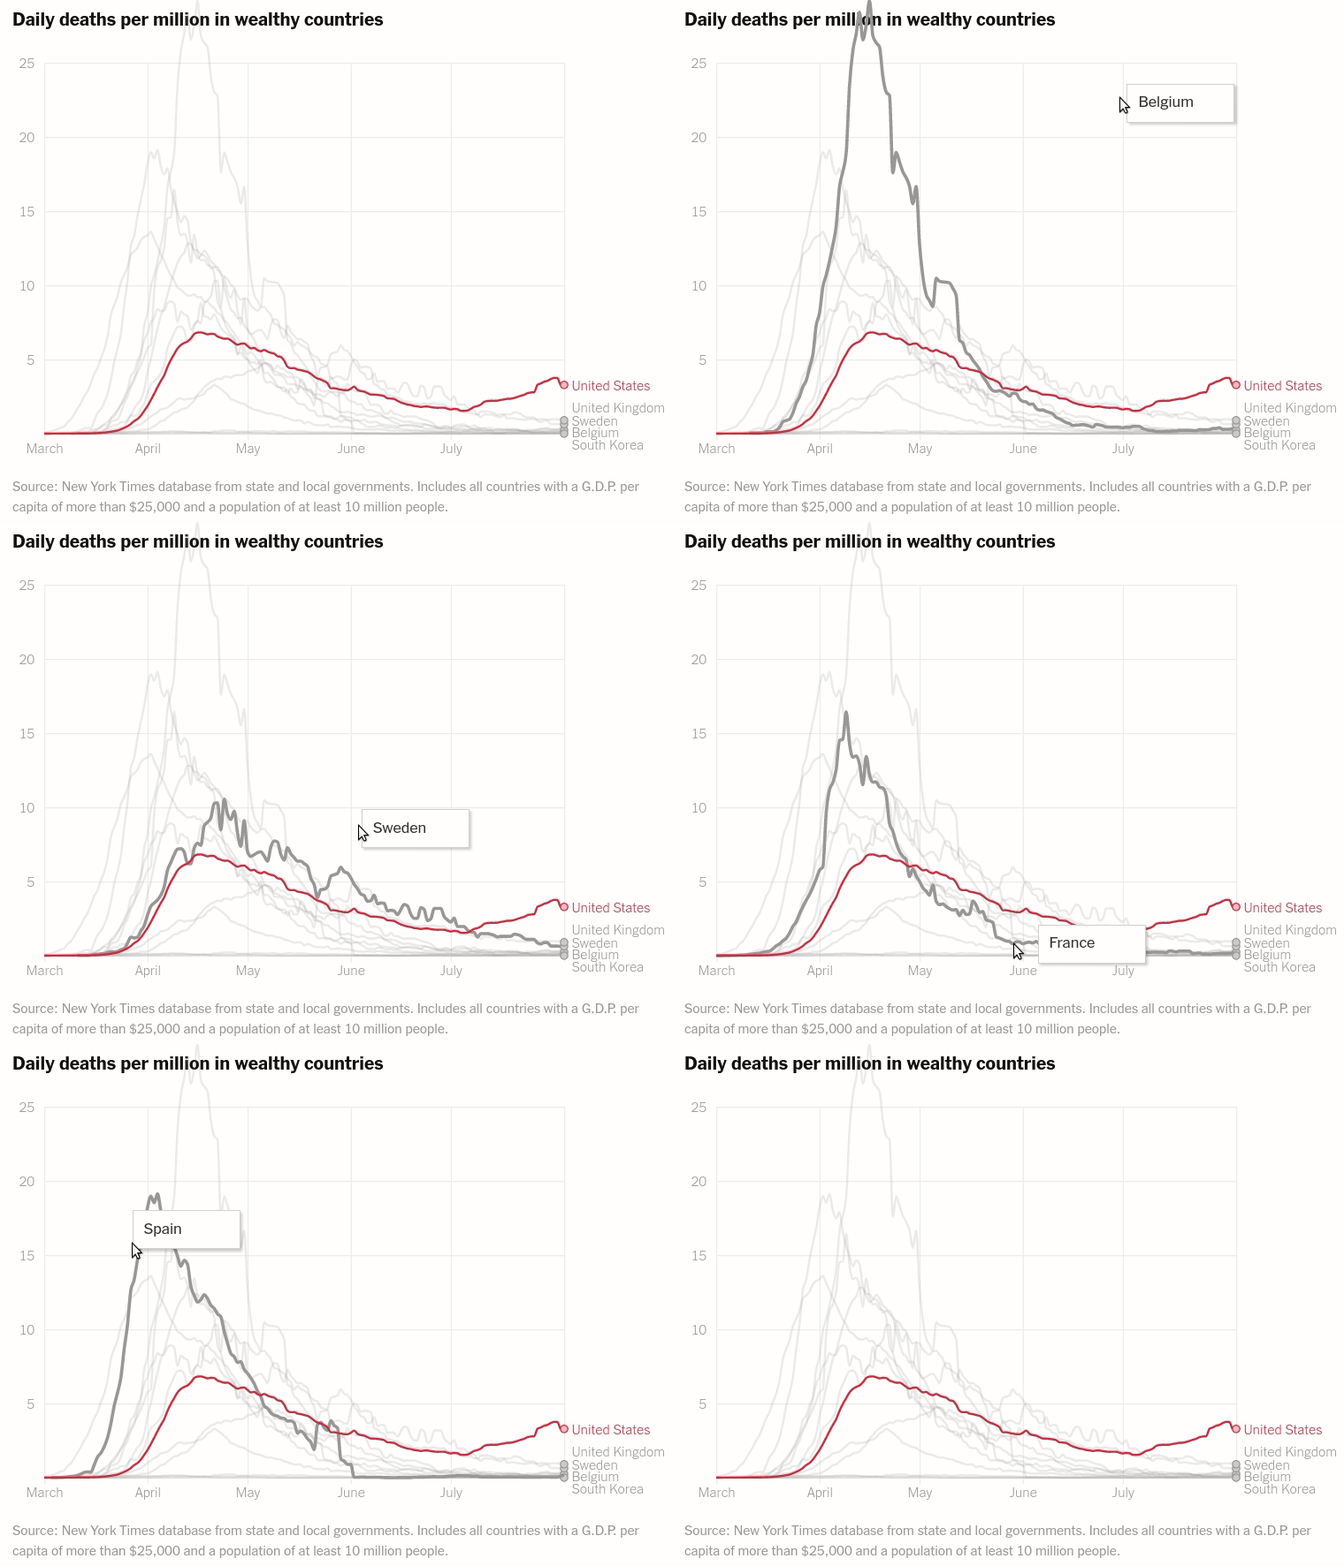
Interactive layered plot of wealthy countrie's daily deaths per million
Today we will make the first chart from the article The unique US failure to control the virus


import pandas as pd
import altair as alt
from functools import wraps
import datetime as dt

alt.renderers.set_embed_options(actions=False)

population_uri = 'https://github.com/CSSEGISandData/COVID-19/blob/master/csse_covid_19_data/UID_ISO_FIPS_LookUp_Table.csv?raw=true'
deaths_ts_uri = 'https://github.com/CSSEGISandData/COVID-19/blob/master/csse_covid_19_data/csse_covid_19_time_series/time_series_covid19_deaths_global.csv?raw=true'
gdp_current_us_dollars = 'https://gist.githubusercontent.com/armsp/58b43f28b4bf880f3874db80630dec44/raw/959a34a1797b0e3fdc860a6ef0057c62ee898dd7/gdp.csv'
deaths_ts = pd.read_csv(deaths_ts_uri)
deaths_ts.head()
gdp_us = pd.read_csv(gdp_current_us_dollars)
gdp_us.head()
population = pd.read_csv(population_uri)
population.head()
def log_step(func):
    @wraps(func)
    def wrapper(dataf, *args, **kwargs):
        """timing or logging etc"""
        start = dt.datetime.now()
        output = func(dataf, *args, **kwargs)
        end = dt.datetime.now()
        print(f"After function {func.__name__} ran, shape of dataframe is - {output.shape}, execution time is - {end-start}")
        return output
    return wrapper

@log_step
def start_pipeline(dataf):
    return dataf.copy()

@log_step
def remove_cols(dataf, *arg, **kwargs):
    #print(list(arg))
    result = dataf.drop(columns=list(arg))
    return result

@log_step
def remove_null(dataf):
    return dataf.dropna()

def rename_cols(dataf, *arg, **kwargs):
    """Rename column names of raw dataframes to something digestable and that looks better in visualization and does not have spaces in between cause altair does not like that"""
    result = dataf.rename(columns=kwargs)
    return result

@log_step
def filter_rows(dataf, which, **kwargs):
    if which == 'gdp':
        result = dataf[dataf['current_us'] != '..']
        return result
    elif which == 'pop':
        result = dataf[pd.isnull(dataf['Province_State'])]
        return result

def set_dtypes(dataf):
    """set the datatypes of columns"""
    # can use data.assign(col = lambda d: pd.to_datetime(d['col'])) or col = pd.to_datetime(d['col'])
    dataf['current_us'] = dataf['current_us'].astype(float)
    return dataf

# def remove_outliers(dataf):
#     """remove outliers"""
#     return dataf

# def add_features(dataf):
#     return dataf

@log_step
def clean(dataf):
    agg_deaths = dataf.groupby('Country/Region').sum().reset_index()
    agg_deaths = agg_deaths[agg_deaths['Country/Region'].isin(pop_w_gdp['Country/Region'])].set_index('Country/Region')
    result = agg_deaths.T.reset_index().rename_axis(None, axis=1).rename(columns={'index': 'Date'})
    result['Date'] = pd.to_datetime(result['Date'], format="%m/%d/%y")
    result = result[result['Date'] < '8/5/20']

    #convert cumulative deaths to daily deaths per million
    for col in result:
        if col != 'Date':
            result[col] = result[col].diff()
            result[col] = (result[col]/int(countries_population[countries_population['Country/Region'] == col]['Population']))*1000000
    return result
gdp = (gdp_us
       .pipe(start_pipeline)
       .pipe(remove_null)
       .pipe(remove_cols, *['Series Name', 'Series Code'])
       .pipe(rename_cols, **{'2019 [YR2019]': 'current_us'})
       .pipe(filter_rows, 'gdp')
       .pipe(set_dtypes))

countries_population = (population
       .pipe(start_pipeline)
       .pipe(filter_rows, 'pop')
       .pipe(remove_cols, *['UID', 'iso2', 'code3', 'FIPS', 'Admin2', 'Province_State', 'Lat', 'Long_', 'Combined_Key'])
       .pipe(rename_cols, **{'iso3': 'Country Code', 'Country_Region':'Country/Region'}))

# Combining population with GDP
pop_w_gdp = countries_population.merge(gdp, how='inner', on='Country Code')

# Filter for only wealthy countries i.e GDP > 25000 USD and population > 10 million
pop_w_gdp = pop_w_gdp[(pop_w_gdp['current_us'] > 25000) & (pop_w_gdp['Population'] > 10000000)]

# Making daily deaths per million data for plotting
plot_data = (deaths_ts
             .pipe(start_pipeline)
             .pipe(remove_cols, *['Province/State', 'Lat', 'Long'])
             .pipe(clean)
             .pipe(remove_null)
            )

plot_data.head()