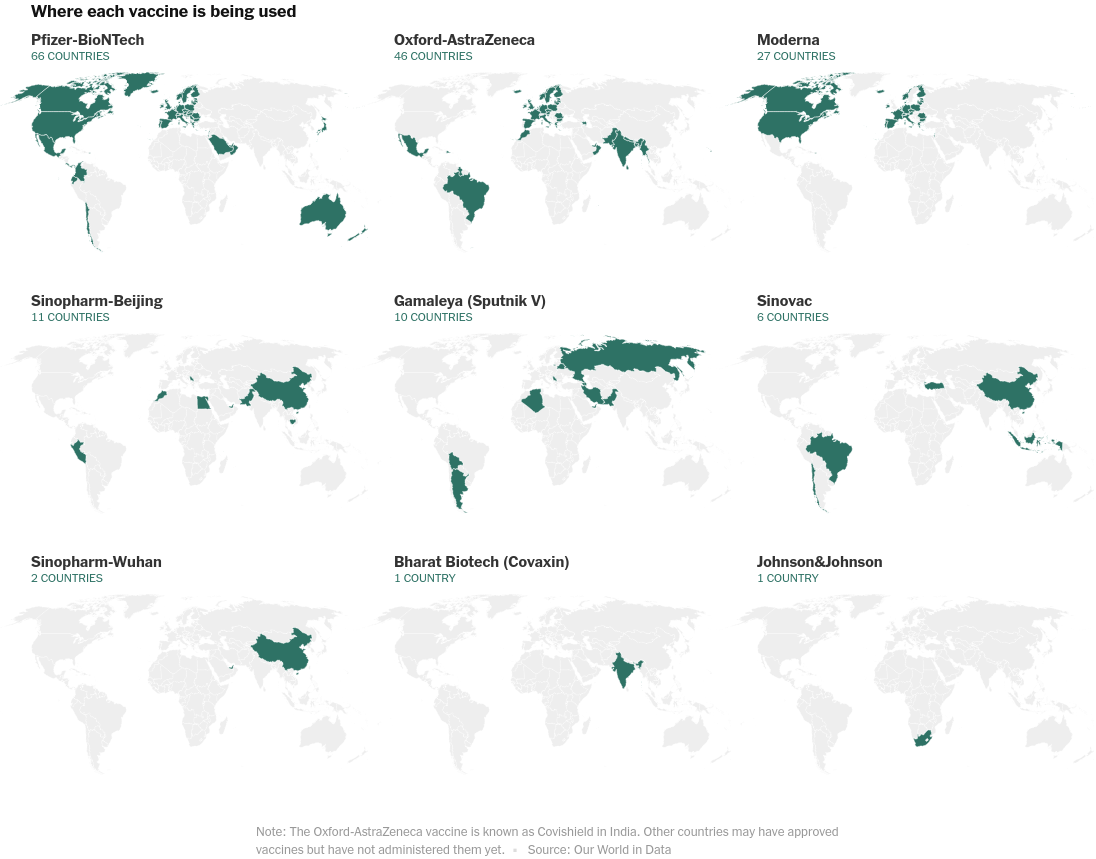
Today we will make the faceted geospatial charts from the article Tracking Coronavirus Vaccinations Around the World and find out about a bug relating to faceting geospatial charts and how to go about achieving the plot till a proper fix is made.

Vaccines faceted

#hide_output
import pandas as pd
import altair as alt
alt.renderers.set_embed_options(actions=False)
owd_vaccine_uri = "https://github.com/owid/covid-19-data/blob/master/public/data/vaccinations/locations.csv"
vaccine_uri_raw_data = "https://raw.githubusercontent.com/owid/covid-19-data/master/public/data/vaccinations/locations.csv"
raw_data = pd.read_csv(vaccine_uri_raw_data)
raw_data.tail()
location iso_code vaccines last_observation_date source_name source_website
97 Turks and Caicos Islands TCA Pfizer/BioNTech 2021-02-08 Ministry of Health https://www.facebook.com/tcihealthpromotions/p...
98 United Arab Emirates ARE Oxford/AstraZeneca, Pfizer/BioNTech, Sinopharm... 2021-02-22 National Emergency Crisis and Disaster Managem... http://covid19.ncema.gov.ae/en
99 United Kingdom GBR Oxford/AstraZeneca, Pfizer/BioNTech 2021-02-21 Government of the United Kingdom https://coronavirus.data.gov.uk/details/health...
100 United States USA Moderna, Pfizer/BioNTech 2021-02-22 Centers for Disease Control and Prevention https://covid.cdc.gov/covid-data-tracker/#vacc...
101 Wales NaN Oxford/AstraZeneca, Pfizer/BioNTech 2021-02-21 Government of the United Kingdom https://coronavirus.data.gov.uk/details/health...

Let's study what unique vaccines are there -

from itertools import chain

set(chain(*raw_data.vaccines.apply(lambda x: map(str.lstrip, x.split(','))).reset_index(drop=True)))
{'Covaxin',
 'Johnson&Johnson',
 'Moderna',
 'Oxford/AstraZeneca',
 'Pfizer/BioNTech',
 'Sinopharm/Beijing',
 'Sinopharm/Wuhan',
 'Sinovac',
 'Sputnik V'}

Now we will split vaccines into a list and explode it so that the dataframe is in the correct format for our visualization purposes -

vaccine_location_data = raw_data.copy()
vaccine_location_data['vaccines'] = vaccine_location_data.vaccines.apply(lambda x: list(map(str.lstrip, x.split(','))))
vaccine_location_data = vaccine_location_data.explode('vaccines').reset_index(drop=True)
vaccine_location_data.tail()
location iso_code vaccines last_observation_date source_name source_website
173 United Kingdom GBR Pfizer/BioNTech 2021-02-21 Government of the United Kingdom https://coronavirus.data.gov.uk/details/health...
174 United States USA Moderna 2021-02-22 Centers for Disease Control and Prevention https://covid.cdc.gov/covid-data-tracker/#vacc...
175 United States USA Pfizer/BioNTech 2021-02-22 Centers for Disease Control and Prevention https://covid.cdc.gov/covid-data-tracker/#vacc...
176 Wales NaN Oxford/AstraZeneca 2021-02-21 Government of the United Kingdom https://coronavirus.data.gov.uk/details/health...
177 Wales NaN Pfizer/BioNTech 2021-02-21 Government of the United Kingdom https://coronavirus.data.gov.uk/details/health...

To check we can get the list of unique vaccines and crosscheck it with what we had earlier -

vaccine_location_data.vaccines.unique()
array(['Pfizer/BioNTech', 'Sputnik V', 'Oxford/AstraZeneca', 'Moderna',
       'Sinopharm/Beijing', 'Sinovac', 'Sinopharm/Wuhan', 'Covaxin',
       'Johnson&Johnson'], dtype=object)

We will also have to deal with some missing values in iso_code so that we can merge it with the geodataframe.

Let's get the map data / shapefiles -

import geopandas as gpd
uri_50m = "https://www.naturalearthdata.com/http//www.naturalearthdata.com/download/50m/cultural/ne_50m_admin_0_countries.zip"
uri_110m = "https://www.naturalearthdata.com/http//www.naturalearthdata.com/download/110m/cultural/ne_110m_admin_0_countries.zip"
countries_raw = gpd.read_file(uri_50m)
countries_map = countries_raw.copy()
countries_map.head()
featurecla scalerank LABELRANK SOVEREIGNT SOV_A3 ADM0_DIF LEVEL TYPE ADMIN ADM0_A3 ... NAME_KO NAME_NL NAME_PL NAME_PT NAME_RU NAME_SV NAME_TR NAME_VI NAME_ZH geometry
0 Admin-0 country 1 3 Zimbabwe ZWE 0 2 Sovereign country Zimbabwe ZWE ... 짐바브웨 Zimbabwe Zimbabwe Zimbábue Зимбабве Zimbabwe Zimbabve Zimbabwe 辛巴威 POLYGON ((31.28789 -22.40205, 31.19727 -22.344...
1 Admin-0 country 1 3 Zambia ZMB 0 2 Sovereign country Zambia ZMB ... 잠비아 Zambia Zambia Zâmbia Замбия Zambia Zambiya Zambia 赞比亚 POLYGON ((30.39609 -15.64307, 30.25068 -15.643...
2 Admin-0 country 1 3 Yemen YEM 0 2 Sovereign country Yemen YEM ... 예멘 Jemen Jemen Iémen Йемен Jemen Yemen Yemen 也门 MULTIPOLYGON (((53.08564 16.64839, 52.58145 16...
3 Admin-0 country 3 2 Vietnam VNM 0 2 Sovereign country Vietnam VNM ... 베트남 Vietnam Wietnam Vietname Вьетнам Vietnam Vietnam Việt Nam 越南 MULTIPOLYGON (((104.06396 10.39082, 104.08301 ...
4 Admin-0 country 5 3 Venezuela VEN 0 2 Sovereign country Venezuela VEN ... 베네수엘라 Venezuela Wenezuela Venezuela Венесуэла Venezuela Venezuela Venezuela 委內瑞拉 MULTIPOLYGON (((-60.82119 9.13838, -60.94141 9...

5 rows × 95 columns

We have a lot of columns here that we do not need. We will drop all that we do not need.

countries_map.columns
Index(['featurecla', 'scalerank', 'LABELRANK', 'SOVEREIGNT', 'SOV_A3',
       'ADM0_DIF', 'LEVEL', 'TYPE', 'ADMIN', 'ADM0_A3', 'GEOU_DIF', 'GEOUNIT',
       'GU_A3', 'SU_DIF', 'SUBUNIT', 'SU_A3', 'BRK_DIFF', 'NAME', 'NAME_LONG',
       'BRK_A3', 'BRK_NAME', 'BRK_GROUP', 'ABBREV', 'POSTAL', 'FORMAL_EN',
       'FORMAL_FR', 'NAME_CIAWF', 'NOTE_ADM0', 'NOTE_BRK', 'NAME_SORT',
       'NAME_ALT', 'MAPCOLOR7', 'MAPCOLOR8', 'MAPCOLOR9', 'MAPCOLOR13',
       'POP_EST', 'POP_RANK', 'GDP_MD_EST', 'POP_YEAR', 'LASTCENSUS',
       'GDP_YEAR', 'ECONOMY', 'INCOME_GRP', 'WIKIPEDIA', 'FIPS_10_', 'ISO_A2',
       'ISO_A3', 'ISO_A3_EH', 'ISO_N3', 'UN_A3', 'WB_A2', 'WB_A3', 'WOE_ID',
       'WOE_ID_EH', 'WOE_NOTE', 'ADM0_A3_IS', 'ADM0_A3_US', 'ADM0_A3_UN',
       'ADM0_A3_WB', 'CONTINENT', 'REGION_UN', 'SUBREGION', 'REGION_WB',
       'NAME_LEN', 'LONG_LEN', 'ABBREV_LEN', 'TINY', 'HOMEPART', 'MIN_ZOOM',
       'MIN_LABEL', 'MAX_LABEL', 'NE_ID', 'WIKIDATAID', 'NAME_AR', 'NAME_BN',
       'NAME_DE', 'NAME_EN', 'NAME_ES', 'NAME_FR', 'NAME_EL', 'NAME_HI',
       'NAME_HU', 'NAME_ID', 'NAME_IT', 'NAME_JA', 'NAME_KO', 'NAME_NL',
       'NAME_PL', 'NAME_PT', 'NAME_RU', 'NAME_SV', 'NAME_TR', 'NAME_VI',
       'NAME_ZH', 'geometry'],
      dtype='object')
#countries_map = countries_map.drop(columns=list(countries_map.columns[:4]) + list(countries_map.columns[5:-1]))
countries_map = countries_map.drop(columns=list(countries_map.columns[:17]) + list(countries_map.columns[18:46]) + list(countries_map.columns[47:-1]))
#countries_map = countries_map.rename(columns={'SOV_A3': 'iso_code'})
countries_map = countries_map.rename(columns={'ISO_A3': 'iso_code'})
countries_map.head()
NAME iso_code geometry
0 Zimbabwe ZWE POLYGON ((31.28789 -22.40205, 31.19727 -22.344...
1 Zambia ZMB POLYGON ((30.39609 -15.64307, 30.25068 -15.643...
2 Yemen YEM MULTIPOLYGON (((53.08564 16.64839, 52.58145 16...
3 Vietnam VNM MULTIPOLYGON (((104.06396 10.39082, 104.08301 ...
4 Venezuela VEN MULTIPOLYGON (((-60.82119 9.13838, -60.94141 9...

Let's find out the mismatches of iso_code for the countries that are there in our vaccine dataset and our geodataframe -

vaccine_location_data[~vaccine_location_data.iso_code.isin(countries_map.iso_code)]#['location'].unique()
location iso_code vaccines last_observation_date source_name source_website
47 England NaN Oxford/AstraZeneca 2021-02-21 Government of the United Kingdom https://coronavirus.data.gov.uk/details/health...
48 England NaN Pfizer/BioNTech 2021-02-21 Government of the United Kingdom https://coronavirus.data.gov.uk/details/health...
57 France FRA Moderna 2021-02-21 Public Health France https://www.data.gouv.fr/fr/datasets/donnees-r...
58 France FRA Oxford/AstraZeneca 2021-02-21 Public Health France https://www.data.gouv.fr/fr/datasets/donnees-r...
59 France FRA Pfizer/BioNTech 2021-02-21 Public Health France https://www.data.gouv.fr/fr/datasets/donnees-r...
63 Gibraltar GIB Pfizer/BioNTech 2021-02-21 Government of Gibraltar https://twitter.com/GibraltarGov/status/136389...
119 Northern Cyprus OWID_NCY Pfizer/BioNTech 2021-01-22 Ministry of Health https://cyprus-mail.com/2021/01/22/coronavirus...
120 Northern Cyprus OWID_NCY Sinovac 2021-01-22 Ministry of Health https://cyprus-mail.com/2021/01/22/coronavirus...
121 Northern Ireland NaN Oxford/AstraZeneca 2021-02-21 Government of the United Kingdom https://coronavirus.data.gov.uk/details/health...
122 Northern Ireland NaN Pfizer/BioNTech 2021-02-21 Government of the United Kingdom https://coronavirus.data.gov.uk/details/health...
123 Norway NOR Moderna 2021-02-21 Norwegian Institute of Public Health https://www.fhi.no/sv/vaksine/koronavaksinasjo...
124 Norway NOR Oxford/AstraZeneca 2021-02-21 Norwegian Institute of Public Health https://www.fhi.no/sv/vaksine/koronavaksinasjo...
125 Norway NOR Pfizer/BioNTech 2021-02-21 Norwegian Institute of Public Health https://www.fhi.no/sv/vaksine/koronavaksinasjo...
145 Scotland NaN Oxford/AstraZeneca 2021-02-21 Government of the United Kingdom https://coronavirus.data.gov.uk/details/health...
146 Scotland NaN Pfizer/BioNTech 2021-02-21 Government of the United Kingdom https://coronavirus.data.gov.uk/details/health...
176 Wales NaN Oxford/AstraZeneca 2021-02-21 Government of the United Kingdom https://coronavirus.data.gov.uk/details/health...
177 Wales NaN Pfizer/BioNTech 2021-02-21 Government of the United Kingdom https://coronavirus.data.gov.uk/details/health...

Let's fix them now -

countries_map.loc[countries_map.NAME == 'France', 'iso_code'] = "FRA"
countries_map.loc[countries_map.NAME == 'Norway', 'iso_code'] = "NOR"
vaccine_location_data.loc[vaccine_location_data.location.isin(['England', 'Wales', 'Scotland', 'Northern Ireland']), 'iso_code'] = "GBR"

FInally let's check once again for any mismatches -

vaccine_location_data[~vaccine_location_data.iso_code.isin(countries_map.iso_code)]#['location'].unique()
location iso_code vaccines last_observation_date source_name source_website
63 Gibraltar GIB Pfizer/BioNTech 2021-02-21 Government of Gibraltar https://twitter.com/GibraltarGov/status/136389...
119 Northern Cyprus OWID_NCY Pfizer/BioNTech 2021-01-22 Ministry of Health https://cyprus-mail.com/2021/01/22/coronavirus...
120 Northern Cyprus OWID_NCY Sinovac 2021-01-22 Ministry of Health https://cyprus-mail.com/2021/01/22/coronavirus...

For our purposes we can ignore these datapoints. Now let's merge the dataframes and plot the results.

plot_data = countries_map.merge(vaccine_location_data, how='inner', on='iso_code')
plot_data.head()
NAME iso_code geometry location vaccines last_observation_date source_name source_website
0 United States of America USA MULTIPOLYGON (((-132.74687 56.52568, -132.7576... United States Moderna 2021-02-22 Centers for Disease Control and Prevention https://covid.cdc.gov/covid-data-tracker/#vacc...
1 United States of America USA MULTIPOLYGON (((-132.74687 56.52568, -132.7576... United States Pfizer/BioNTech 2021-02-22 Centers for Disease Control and Prevention https://covid.cdc.gov/covid-data-tracker/#vacc...
2 Saint Helena SHN MULTIPOLYGON (((-5.69214 -15.99775, -5.78252 -... Saint Helena Oxford/AstraZeneca 2021-02-03 Government of Saint Helena https://www.sainthelena.gov.sh/2021/news/covid...
3 Anguilla AIA POLYGON ((-63.00122 18.22178, -63.16001 18.171... Anguilla Oxford/AstraZeneca 2021-02-14 Ministry of Health https://www.facebook.com/MinistryofHealthAngui...
4 Falkland Is. FLK MULTIPOLYGON (((-58.85020 -51.26992, -58.69751... Falkland Islands Oxford/AstraZeneca 2021-02-15 Government of the Falkland Islands https://www.facebook.com/FalkIandsGov/posts/42...
alt.Chart(plot_data).mark_geoshape().encode(
    color='vaccines:N'
).project('equalEarth')

This is a little misleading because countries have multiple vaccines approved for their usages but we will get only one color here. So we will facet our chart based on the vaccine

alt.Chart(plot_data).mark_geoshape().encode(
    color='vaccines:N',
    #tooltip = ['location'],
    facet=alt.Facet('vaccines:N', columns=3)
).properties(width=100, height=100)

Well this is surprising. It should have worked isn't it?

Unfortunately there is a bug with faceting geoshape plots in Vega-Lite that you can follow in this issue. So for that we will try to achieve faceting by concatenating our charts drawn with filtered data.

alt.concat(*(
    alt.Chart(plot_data[plot_data['vaccines']==vaccine], title=vaccine).mark_geoshape().encode(
        color=alt.value('green'),
        #tooltip=['location'],
    )
    for vaccine in list(plot_data.vaccines.unique())
    ), columns=3, title="Where each vaccine is being used"
)

This is great. Now we will give it some finishing touches -

base = alt.Chart(countries_map[countries_map.iso_code!='ATA']).mark_geoshape(fill='#eee', stroke="#fff", strokeWidth=0.5).project('equalEarth')

alt.concat(*(
    base + alt.Chart(plot_data[plot_data['vaccines']==vaccine], title=vaccine, height=200, width=350).mark_geoshape(stroke="#fff", strokeWidth=0.5).encode(
        color=alt.value('#2e7265'),
        #tooltip=['NAME'],
    )
    for vaccine in list(plot_data.vaccines.unique())
    ), columns=3, title="Where each vaccine is being used", spacing=0
).configure_view(strokeWidth=0)